Usage
Here we walk you through the steps to start analyzing hmis data in a python/Jupyter environment.
Note that in the scripts_and_examples subdirectory, there are some
Jupyter notebooks that walk you through some simple selection and visualization
examples.
Create primary dictionary file
Put together a dictionary of all the individuals in the HMIS data dump and determine the connections and relationships between the different entries in the different files.
First create the .pkl file:
$ python build_primary_dictionary_file.py <tag>
You will want to edit this file to point it to the directory where the 11 .csv files from the HMIS database dump reside.
This creates an output file
hmis_data<tag>,pkl
The script is set up by default to look in hmis/test_data for the .csv files.
This repository provides a very small sample of fake HMIS data for the
unit tests. There is also a sample pickle file includes (in case you don’t want to
build your own for testing) called hmis_test_data.pkl
(there is also a pickle file created for python 2.7 users called hmis_test_data_py27.pkl).
In both cases, the identifier for individuals Personal ID has been
hashed and anonymized.
Examples below that display plots use a more complete data sample than the fake data included with this repository.
Warning! If you are working with a particularly large HMIS data dump, it can take up to an hour or more to build the pickle file. However, your later analysis will be quite fast.
Now let’s take a look at some of this data. The following commands are what you would type in Jupyter/IPython or in a python script.
Import necessary packages
>>> import hmis
>>> import plotly
>>> import matplotlib.pylab as plt
>>> import folium # For mapping
If you are using a Jupyter notebook make sure to include the following in order to display plots inline.
>>> plotly.offline.init_notebook_mode()
>>> %matplotlib notebook
Read the dictionary file
Once you have made your pickle file of the data dump, you can read it.
In the following example, data is a list of dictionaries.
Note that hmis_data.pkl is the file you created, but if you want, you
can use the sample file included in this repo, hmis_test_data.pkl
(or hmis_test_data_py27.pkl if you use python 2.7).
>>> filename = 'hmis_data.pkl'
>>> data = hmis.read_dictionary_file(filename)
Pretty print a subset of individuals
>>> hmis.pretty_print(data[0:10])

================================
91585d365
01/15/1972
Emergency Shelter                   In/Out: 08/21/2012 - 09/11/2012 (21 days)    Zip code: 12901
Services Only                       In/Out: 04/03/2012 - 04/26/2012 (23 days)    Zip code: 12901
Services Only                       In/Out: 03/11/2013 - 03/22/2013 (11 days)    Zip code: 12901
Services Only                       In/Out: 04/20/2012 - 09/01/2012 (134 days)   Zip code: 12901
Services Only                       In/Out: 03/22/2013 - 05/21/2013 (60 days)    Zip code: 12901
================================
935135846
03/09/1993
Emergency Shelter                   In/Out: 09/25/2014 - 09/29/2014 (4 days)     Zip code: 12250
Emergency Shelter                   In/Out: 09/30/2014 - 10/03/2014 (3 days)     Zip code: 12250
Emergency Shelter                   In/Out: 10/13/2014 - 10/14/2014 (1 days)     Zip code: 12250
Emergency Shelter                   In/Out: 10/15/2014 - 10/17/2014 (2 days)     Zip code: 12250
Emergency Shelter                   In/Out: 11/03/2014 - 11/04/2014 (1 days)     Zip code: 12250
================================
1cb8da6b1
11/17/1978
Emergency Shelter                   In/Out: 08/29/2013 - 08/30/2013 (1 days)     Zip code: 12180
Emergency Shelter                   In/Out: 09/02/2013 - 09/06/2013 (4 days)     Zip code: 12180
Emergency Shelter                   In/Out: 09/08/2013 - 09/10/2013 (2 days)     Zip code: 12180
================================
92e935388
09/20/1952
PH - Rapid Re-Housing               In/Out: 12/07/2012 - 07/07/2014 (577 days)   Zip code: 12601
Emergency Shelter                   In/Out: 04/12/2012 - 04/25/2012 (13 days)    Zip code: 12601
Emergency Shelter                   In/Out: 04/26/2012 - 04/27/2012 (1 days)     Zip code: 12601
Emergency Shelter                   In/Out: 05/04/2012 - 05/06/2012 (2 days)     Zip code: 12601
Emergency Shelter                   In/Out: 05/07/2012 - 05/12/2012 (5 days)     Zip code: 12601
Emergency Shelter                   In/Out: 05/15/2012 - 05/16/2012 (1 days)     Zip code: 12601
...
In the above case, the first 10 entries in the file (fewer are displayed for readability) are printed
out. However, you could select a subset of individuals, based on their Personal ID. The following example
returns a subset of the data selected this way as a list.
>>> names = ['91585d365', '935135846', '1cb8da6b1','92e935388', '9293c9520', '1cb9a120b']
>>> subset = hmis.subset_from_dictionary(names,data)
Select individuals of interest to visualize
From this list of dictionaries data, you can select individuals that are within a certain age range:
>>> lo = 31
>>> hi = 33
>>> selected_people = hmis.select_by_age(data,lo=lo,hi=hi)
Additionally, you can select individuals from data that have been to at least a certain number of progams:
>>> num_of_programs = 27
>>> selected_people = hmis.select_by_number_of_programs(data,num_of_programs)
Get additional information about individuals and projects
The file that is created by the build_dictionary_file.py script is relatively lightweight
and does not contain all the information from the full HMIS data dump. However, analysts
might want to access this and can by accessing the original data in the .csv files.
The five of most interest, ('Enrollment.csv','Exit.csv','Project.csv','Client.csv','Site.csv')
can be returned as a dictionary file, indexed by the names (minus the .csv) of each
of the files.
>>> alldata = hmis.read_in_data(directory='../test_data')
>>> print(alldata.keys())

dict_keys(['Enrollment', 'Exit', 'Project', 'Client', 'Site'])
Each value associated with a key in alldata is a Pandas dataframe, containing
all the information read in from the .csv files from the HMIS data dump.
We provide simple accessor functions to pull out information on an individual
using their PersonalID, a project using its ProjectID or a specific instance
of a person entering a support project using the ProjectEntryID.
The user passes in the ID of choice along with the information that is asked for. Users should familiarize themselves with what is accessible by referencing the HMIS data format.
>>> vals = hmis.get_additional_info('230978041',idtype='Personal',org_data=alldata,info='WorldWarII')
>>> print(vals)

{'230978041': {'WorldWarII': 'EMPTY'}}
>>> vals = hmis.get_additional_info('230978041',idtype='Personal',org_data=alldata,info=['Gender','Ethnicity','WorldWarII'])
>>> print(vals)

{'230978041': {'Gender': '0', 'Ethnicity': '0', 'WorldWarII': 'EMPTY'}}
>>> vals = hmis.get_additional_info('552310',idtype='ProjectEntry',org_data=alldata,info=['HouseholdID','RelationshipToHoH','ResidencePrior'])
>>> print(vals)
{'552310': {'HouseholdID': '230282', 'RelationshipToHoH': '2', 'ResidencePrior': 'EMPTY'}}
>>> vals = hmis.get_additional_info('72732241',idtype='Project',org_data=alldata,info=['Address','ProjectName'])
>>> print(vals)

{'72732241': {'Address': '1313 Mockingbird Lane Nowhere NY 99999', 'ProjectName': 'Training Emergency Shelter'}}
>>> vals = hmis.get_additional_info(['567519','561729'],idtype='ProjectEntry',org_data=alldata,info=['MonthsHomelessPastThreeYears'])
>>> print(vals)

{'567519': {'MonthsHomelessPastThreeYears': '101'}, '561729': {'MonthsHomelessPastThreeYears': '110'}}
Visualize time-series plots
From the selected_people, you can plot their time-series plots:
>>> image_name = 'plotting_example.png'
>>> fig = plt.figure(figsize=(12,5)
>>> hmis.plot_time_series(selected_people, image_name)
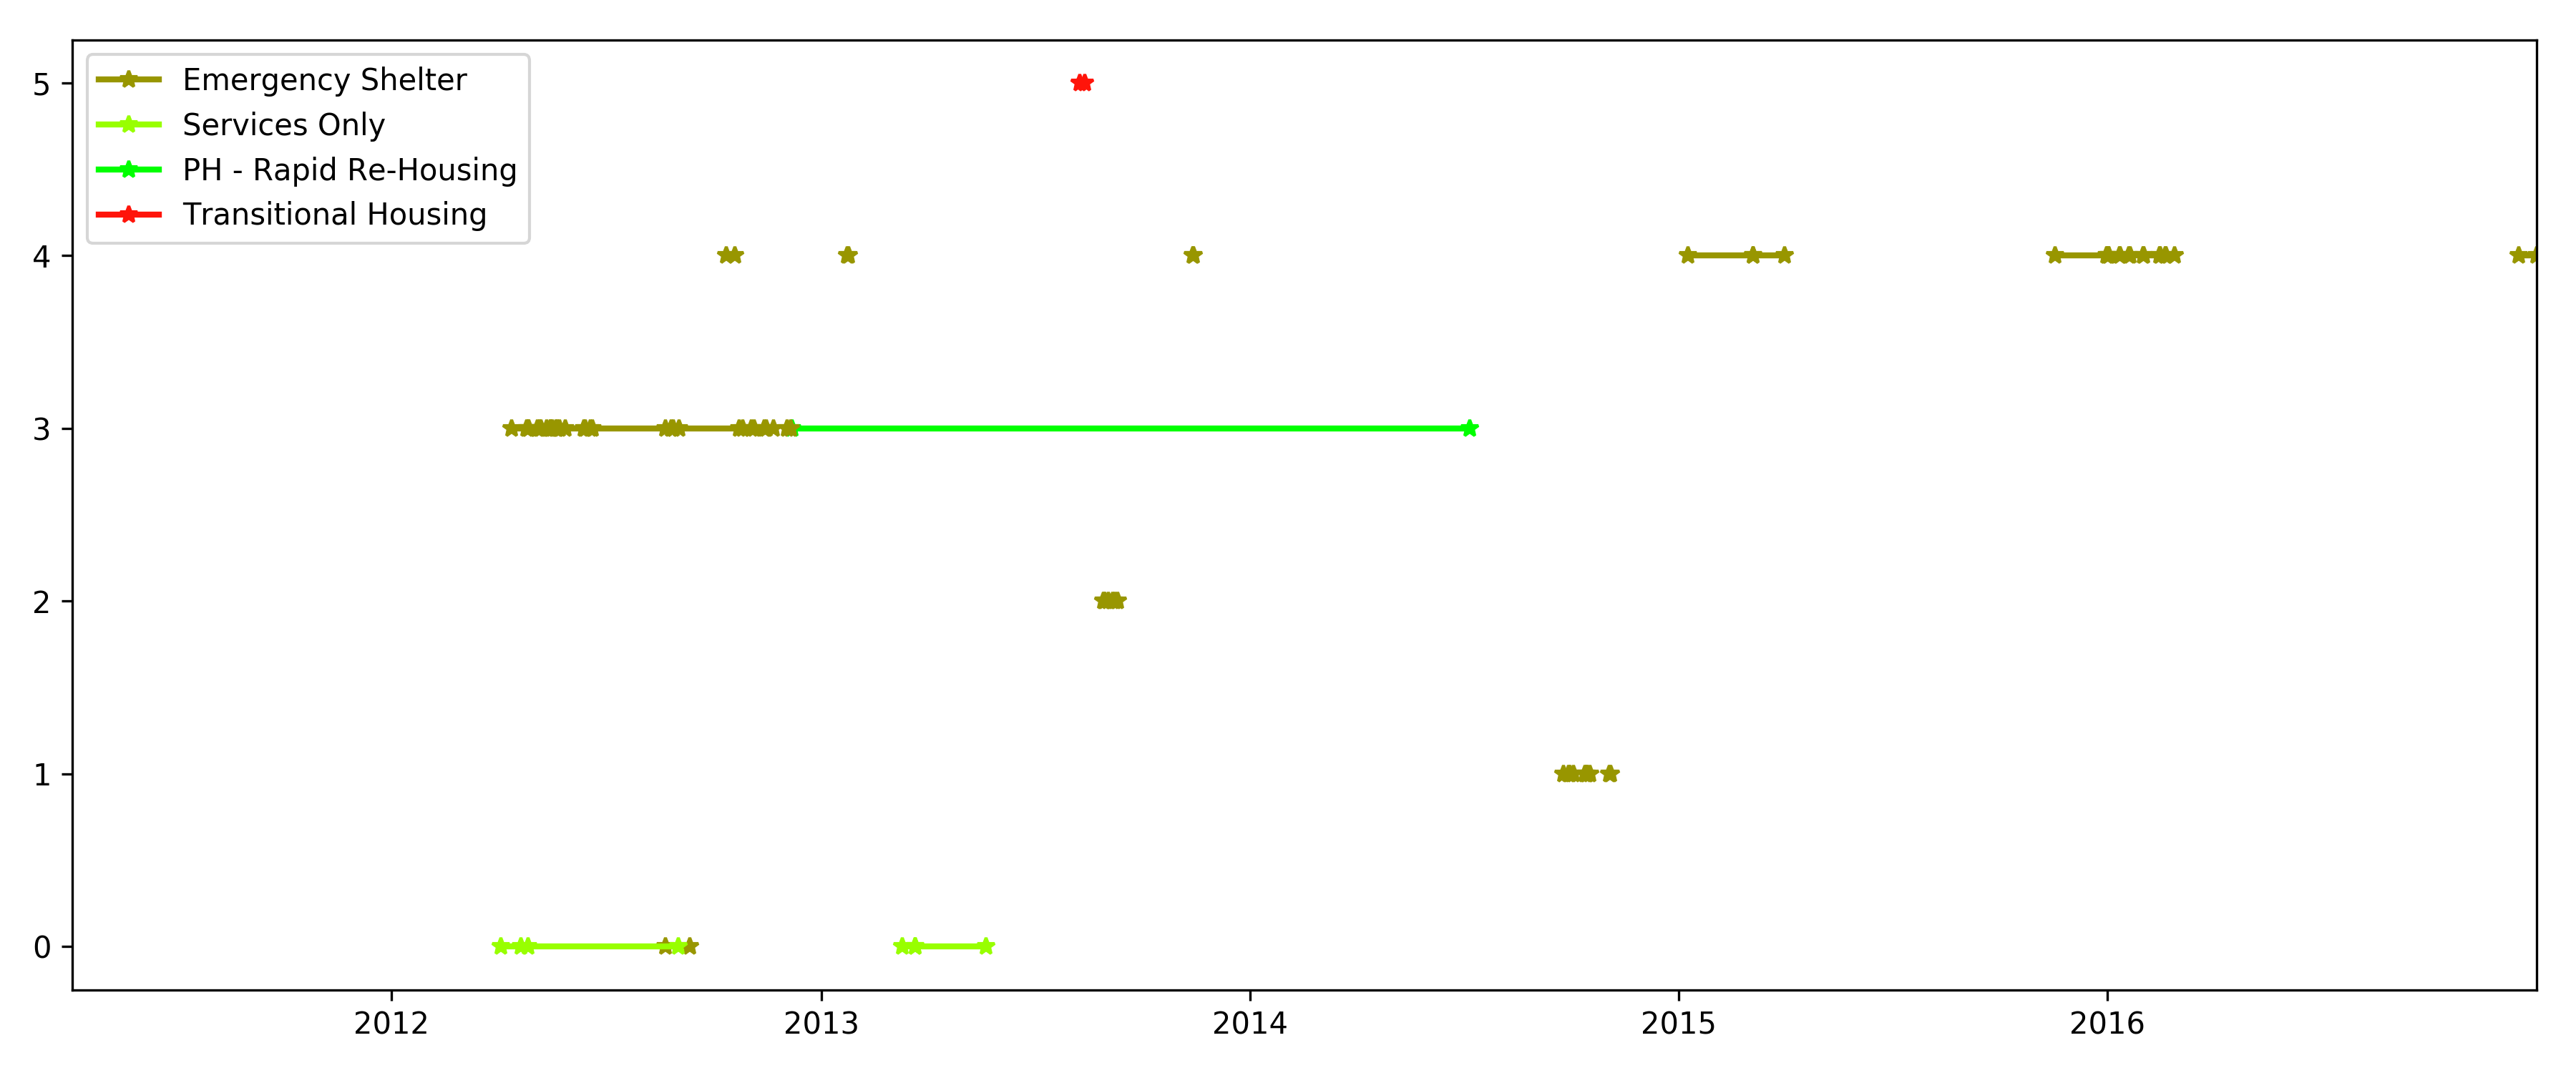
Sample time series for a subset of individuals from the dataset. Each row represents an individual and when they entered or exited various support systems.
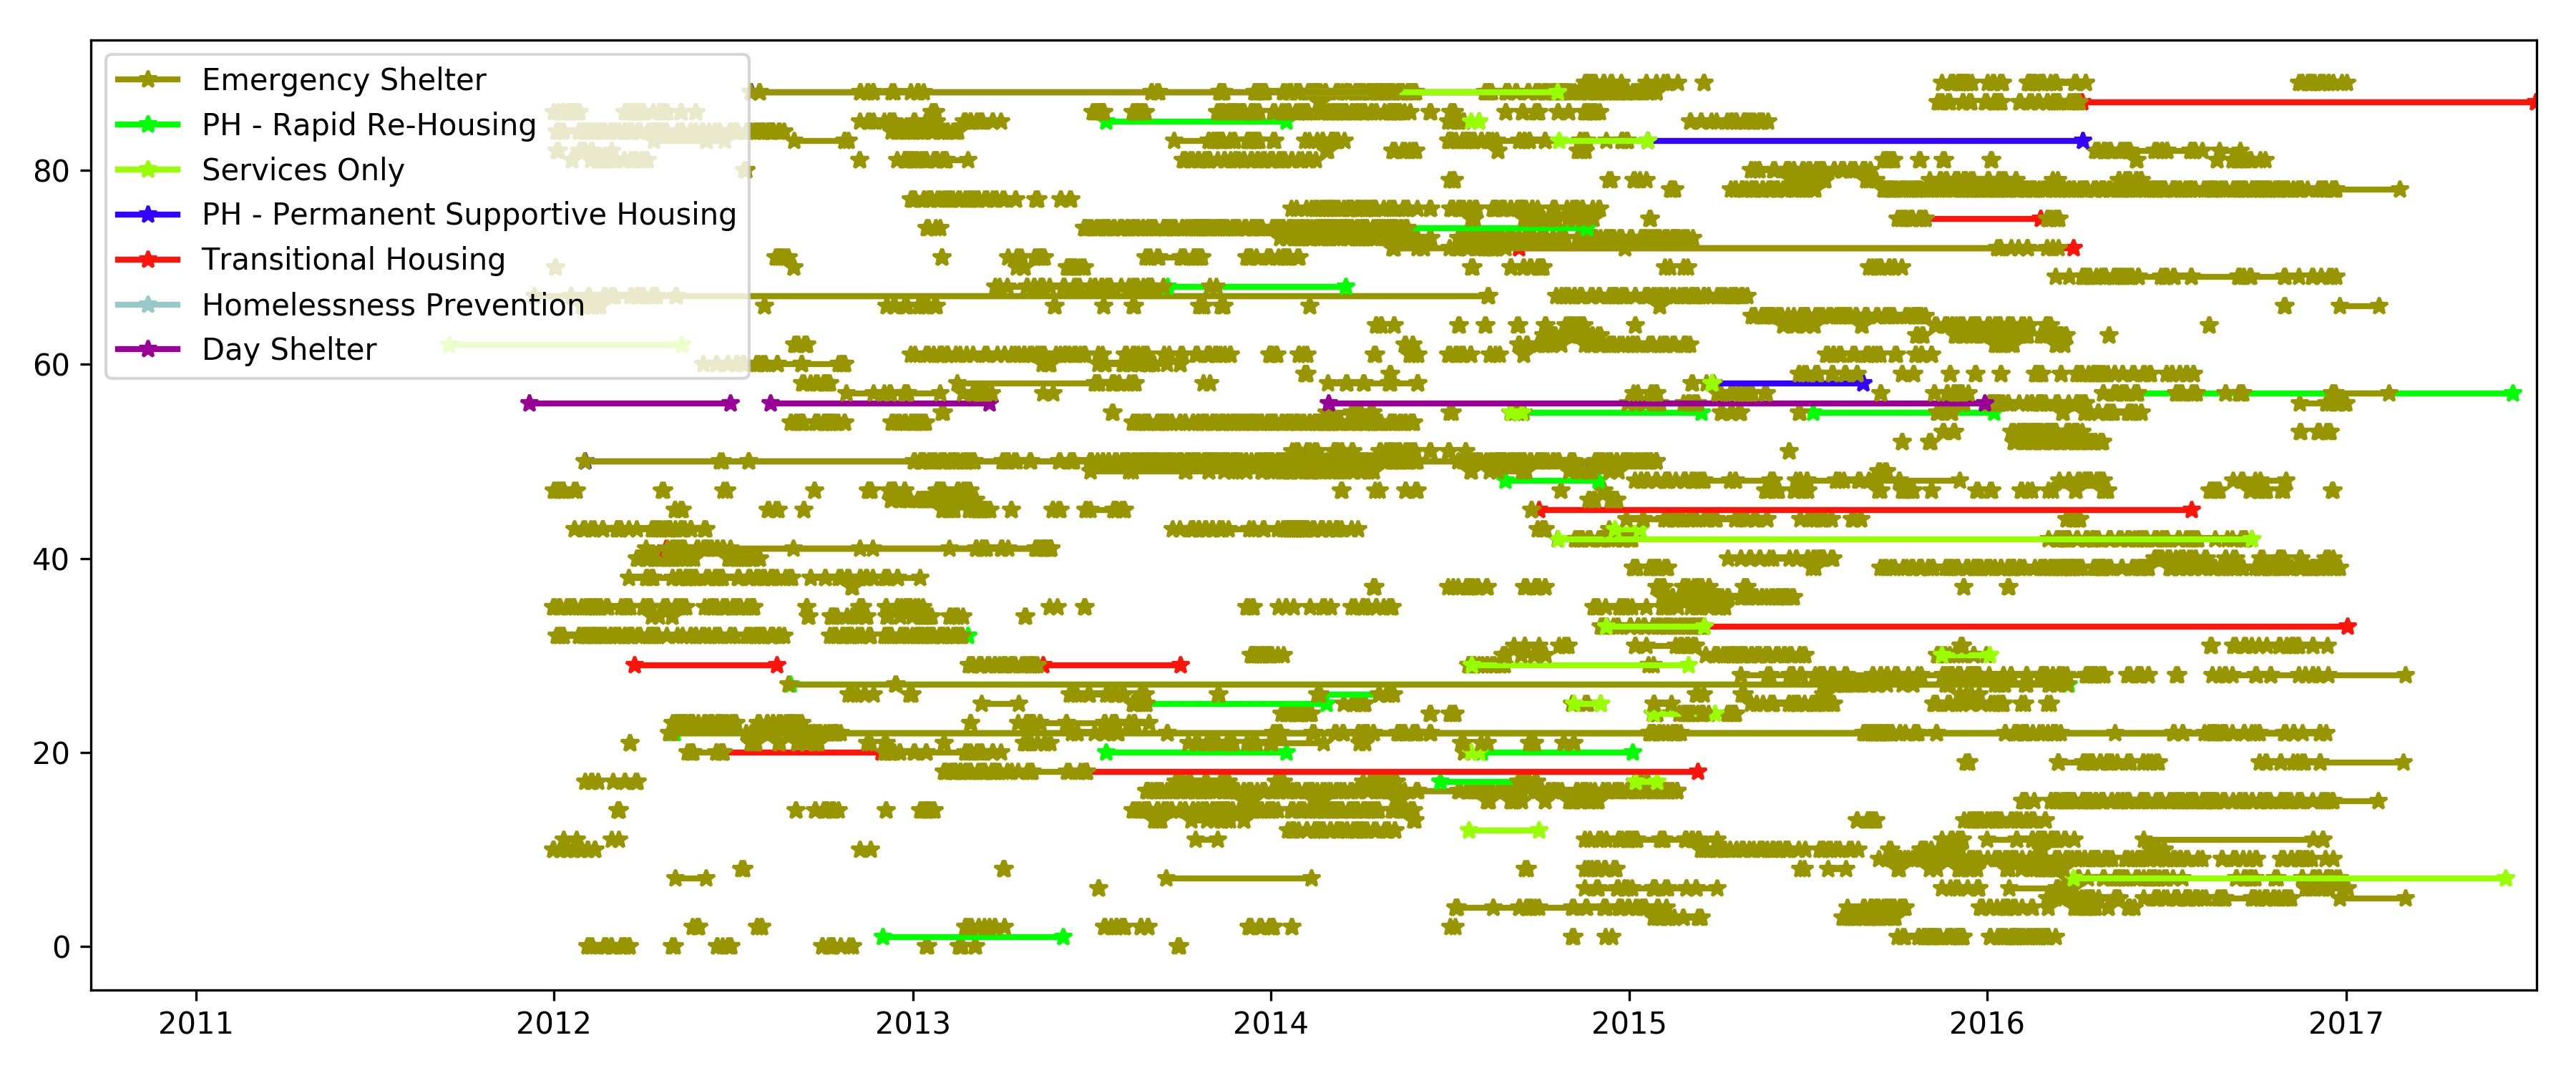
Sample time series for a subset for a larger number of individuals.
You can also add an additional argument and value plotly=True to use the plotly plotting module.
Visualize program locations
From the selected_people, you can plot the location of their programs.
(this only works in the Jupyter environment)
>>> mymap = hmis.plot_program_locations(data[0:2])
>>> mymap
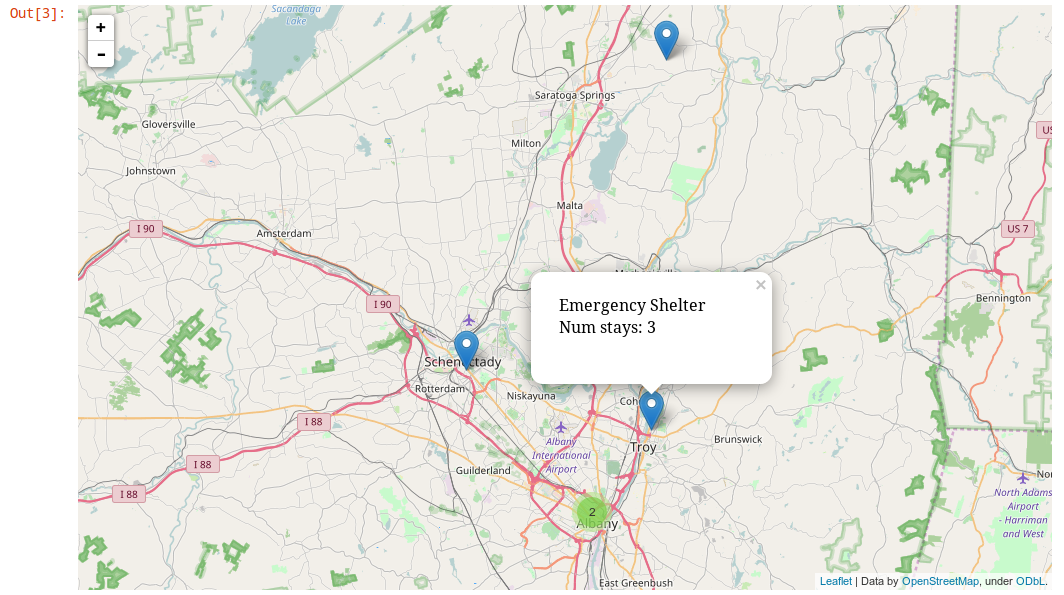
Map of locations of support mechanisms used by the two individuals passed in. Hovertext of the markers reveals the zipcode and the total number of times all individuals have stayed there.
Write your own visualizations
Because the basic data is imported into an environment, users have access to the full python ecosystem and are encouraged to expand upon these visualizations and analysis functions.